Observability
Observability is available on all plans
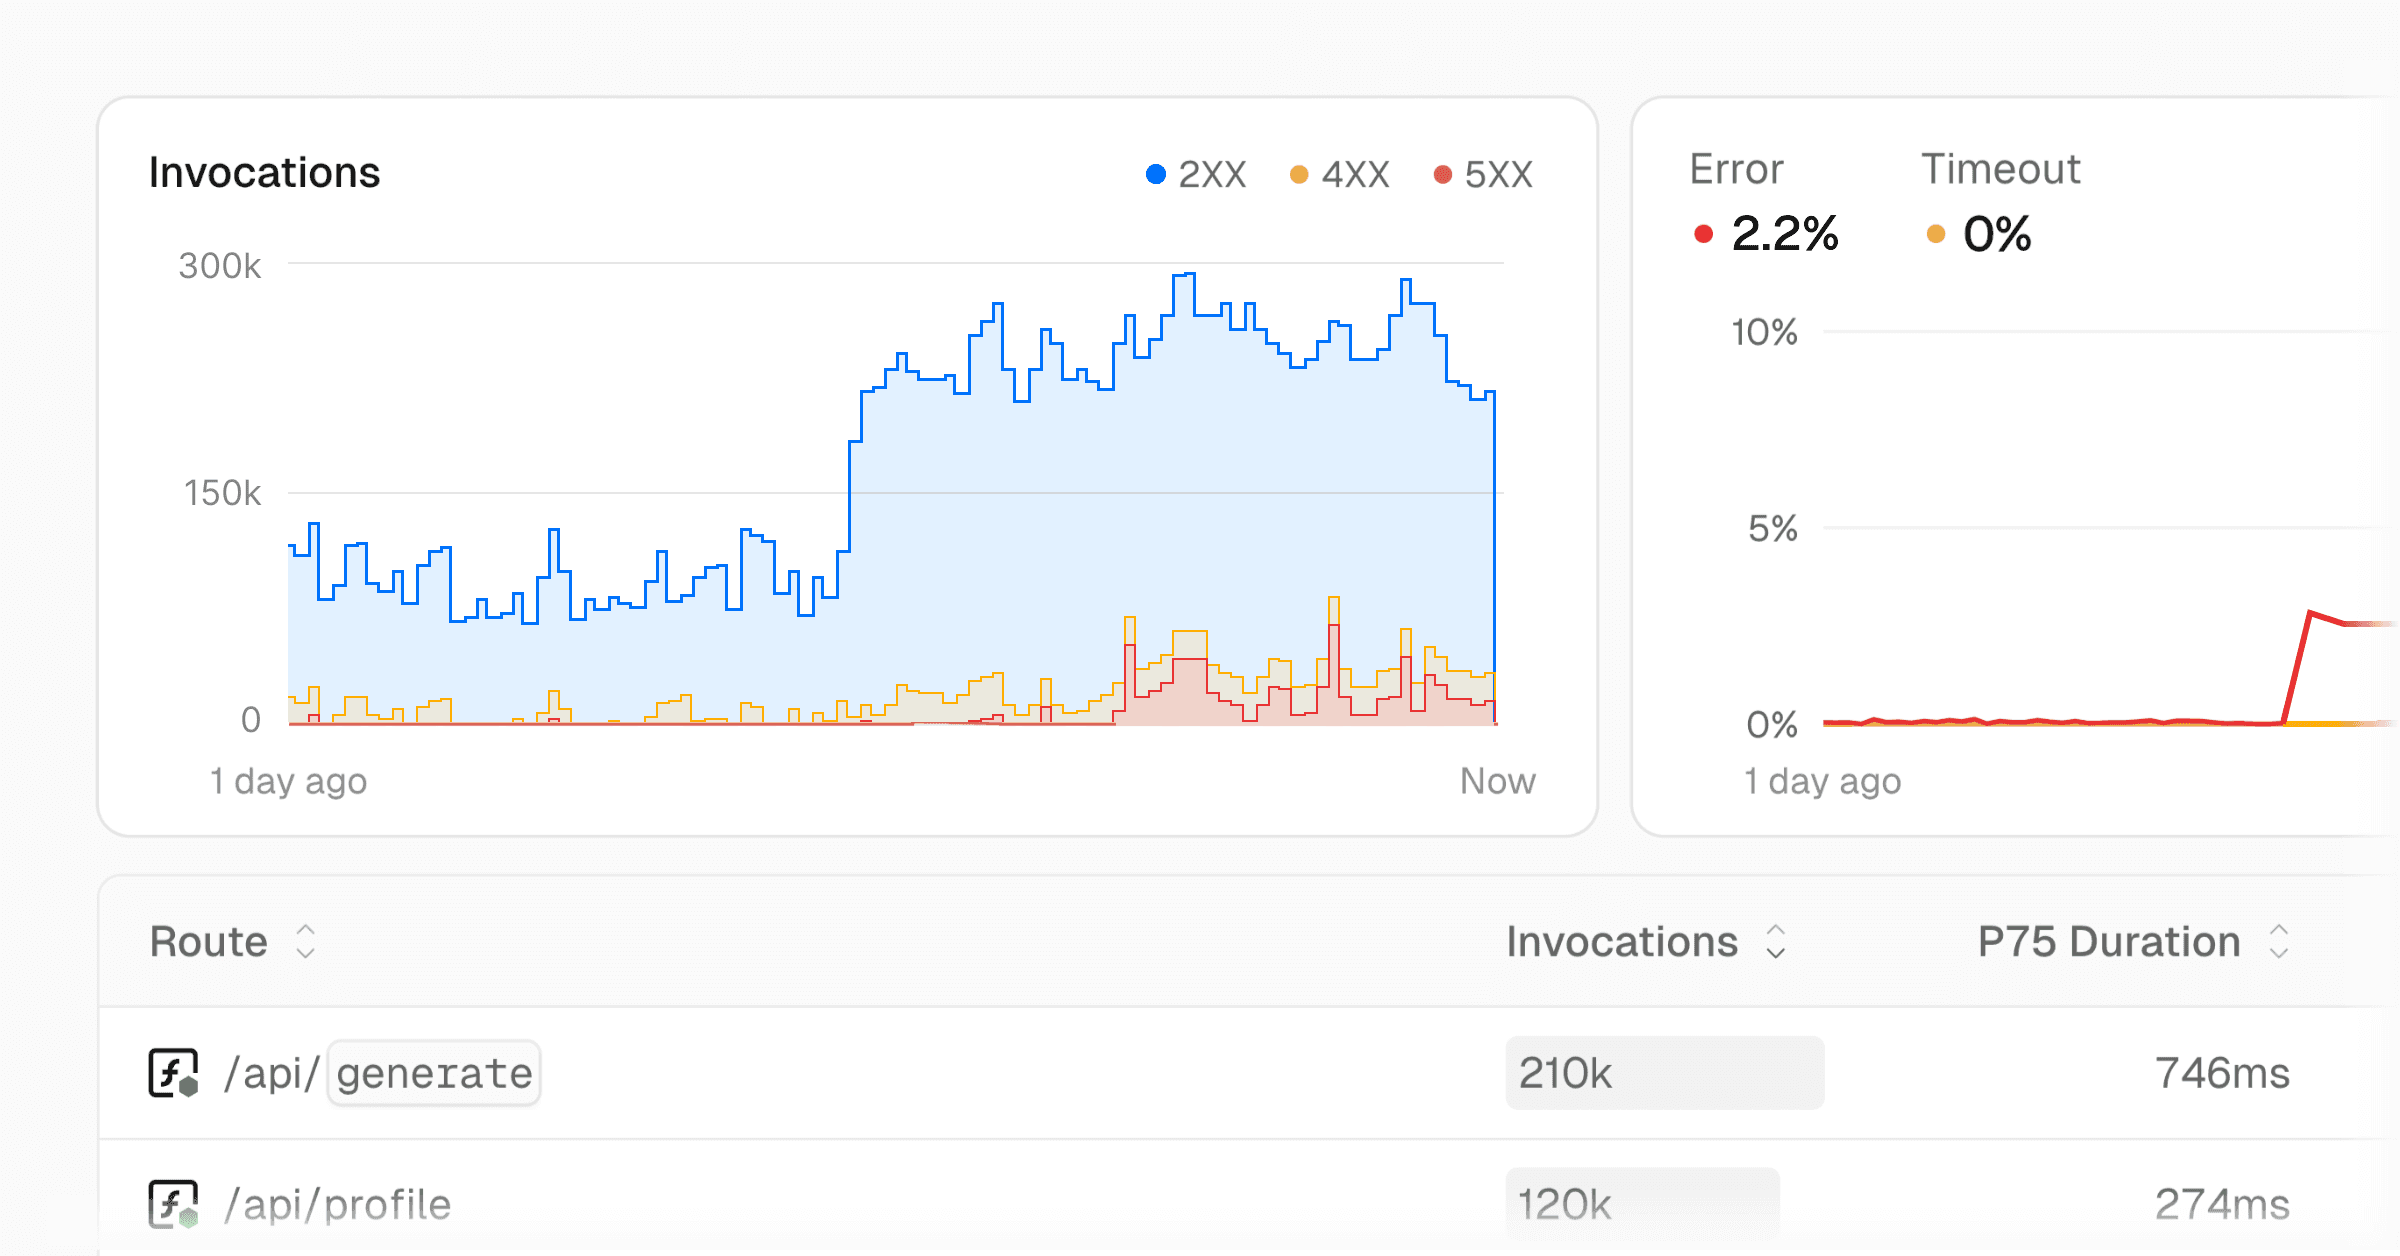
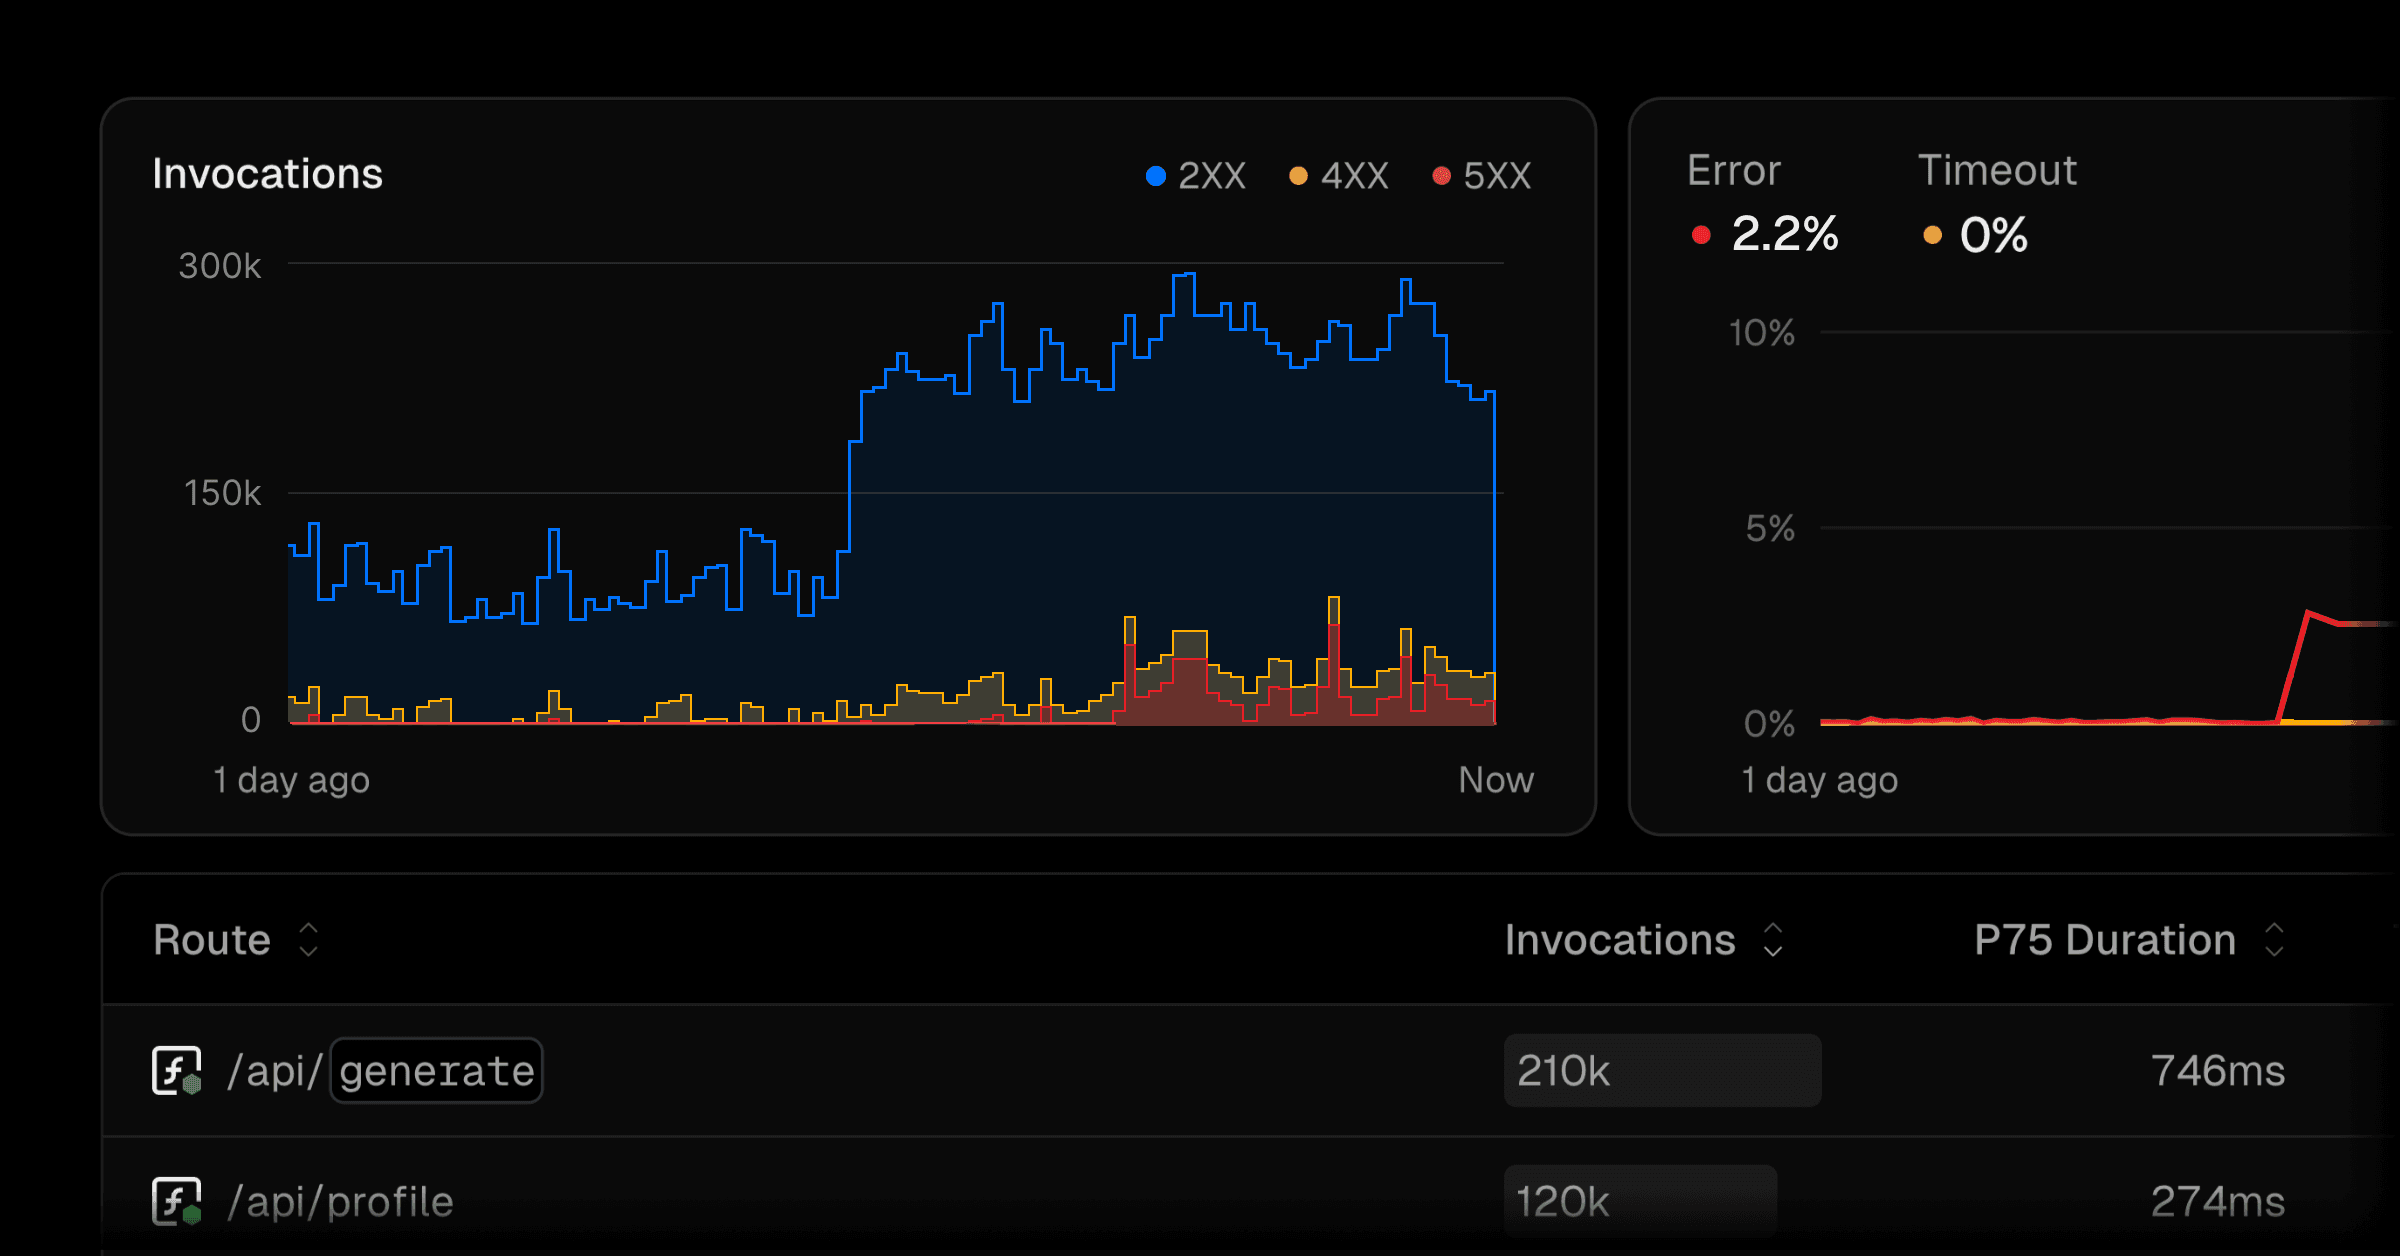
Observability provides a way for you to monitor and analyze the performance and traffic of your projects on Vercel through a variety of events and insights, aligned with your app's architecture.
- Learn how to use Observability and the available insight sections
- Learn how you can save and organize your Observability queries with Notebooks
You can use Observability on all plans to monitor your projects. If you are on the Pro or Enterprise plan, you can upgrade to Observability Plus to get access to additional features and metrics, Monitoring access, higher limits, and increased retention.
Try Observability to get started.


How you use Observability depends on the needs of your project, for example, perhaps builds are taking longer than expected, or your Vercel Functions seem to be increasing in cost. A brief overview of how you might use the tab would be:
- Decide what feature you want to investigate. For example, Vercel Functions.
- Use the date picker or the time range selector to choose the time period you want to investigate. Users on Observability Plus will have a longer retention period and more granular data.
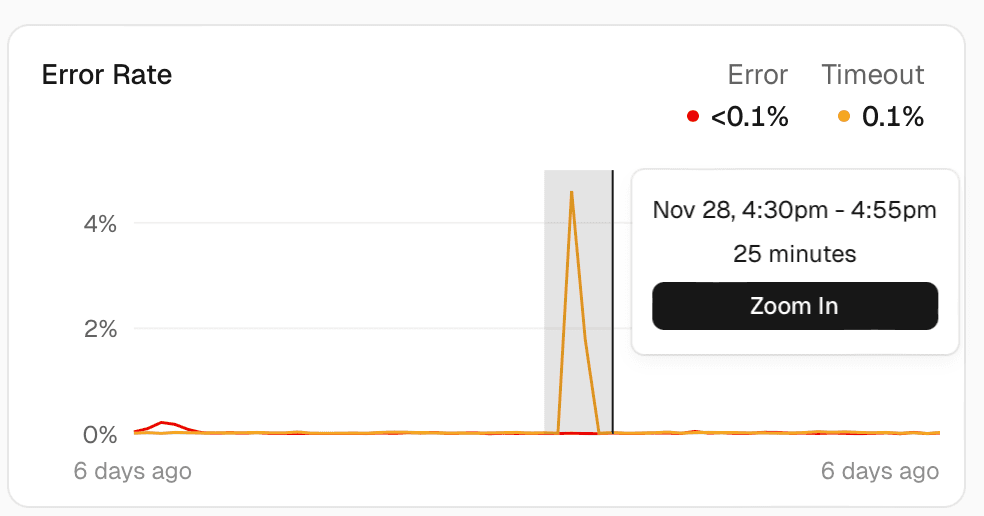
- Let's investigate our graphs in more detail, for example, Error Rate. Click and drag to select a period of time and press the Zoom In button.


- Then, from the list of routes below, choose to reorder either based on the error rate or the duration to get an idea of which routes are causing the most issues.
- To learn more about specific routes, click on the route.
- The functions view will show you the performance of each route or function, including details about the function, latency, paths, and External APIs. Note that Latency and breakdown by path are only available for Observability Plus users.
- The function view also provides a direct link to the logs for that function, enabling you to pinpoint the cause of the issue.
Observability provides different sections of features and traffic sources that help you monitor, analyze, and manage your applications either at the team or the project level. The following table shows their availability at each level:
| Data source | Team Level | Project Level |
|---|---|---|
| Vercel Functions | ✓ | ✓ |
| External APIs | ✓ | ✓ |
| Edge Requests | ✓ | ✓ |
| Middleware | ✓ | ✓ |
| Fast Data Transfer | ✓ | ✓ |
| Image Optimization | ✓ | ✓ |
| ISR (Incremental Static Regeneration) | ✓ | ✓ |
| Blob | ✓ | |
| Build Diagnostics | ✓ | |
| AI Gateway | ✓ | ✓ |
| External Rewrites | ✓ | ✓ |
| Microfrontends | ✓ | ✓ |
Vercel tracks the following event types for Observability:
- Edge Requests
- Vercel Function Invocations
- External API Requests
- Routing Middleware Invocations
- AI Gateway Requests
Vercel creates one or more of these events each time a request is made to your site. Depending on your application and configuration a single request to Vercel might be:
- 1 edge request event if it's cached.
- 1 Edge Request, 1 Middleware, 1 Function Invocation, 2 External API calls, and 1 AI Gateway request, for a total of 6 events.
- 1 edge request event if it's a static asset.
Events are tracked on a team level, and so the events are counted across all projects in the team.
Users on all plans can use Observability at no additional cost, with some limitations. The Observability tab is available on the project dashboard for all projects in the team.
Owners on Pro and Enterprise teams can upgrade to Observability Plus to get access to additional features higher limits, and increased retention.
For more information on pricing, see Pricing.
Monitoring is now automatically included with Observability Plus and cannot be purchased separately. For existing Monitoring users, the Monitoring tab on your dashboard will continue to exist and can be used in the same way that you've always used it.
Teams that are currently paying for Monitoring, will not automatically see the Observability Plus features and benefits on the Observability tab, but will be able to see reduced pricing. In order to use Observability Plus you should migrate using the modal. Once you upgrade to Observability Plus, you cannot roll back to the original Monitoring plan. To learn more, see Monitoring Limits and Pricing.
In addition, teams that subscribe to Observability Plus will have access to the Monitoring tab and its features.
Was this helpful?

